|
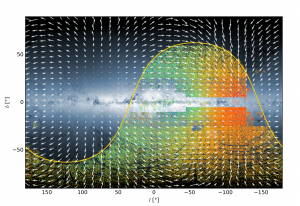
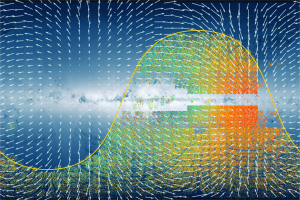
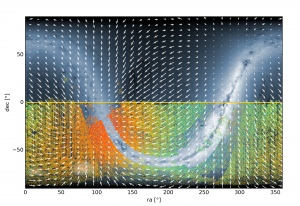
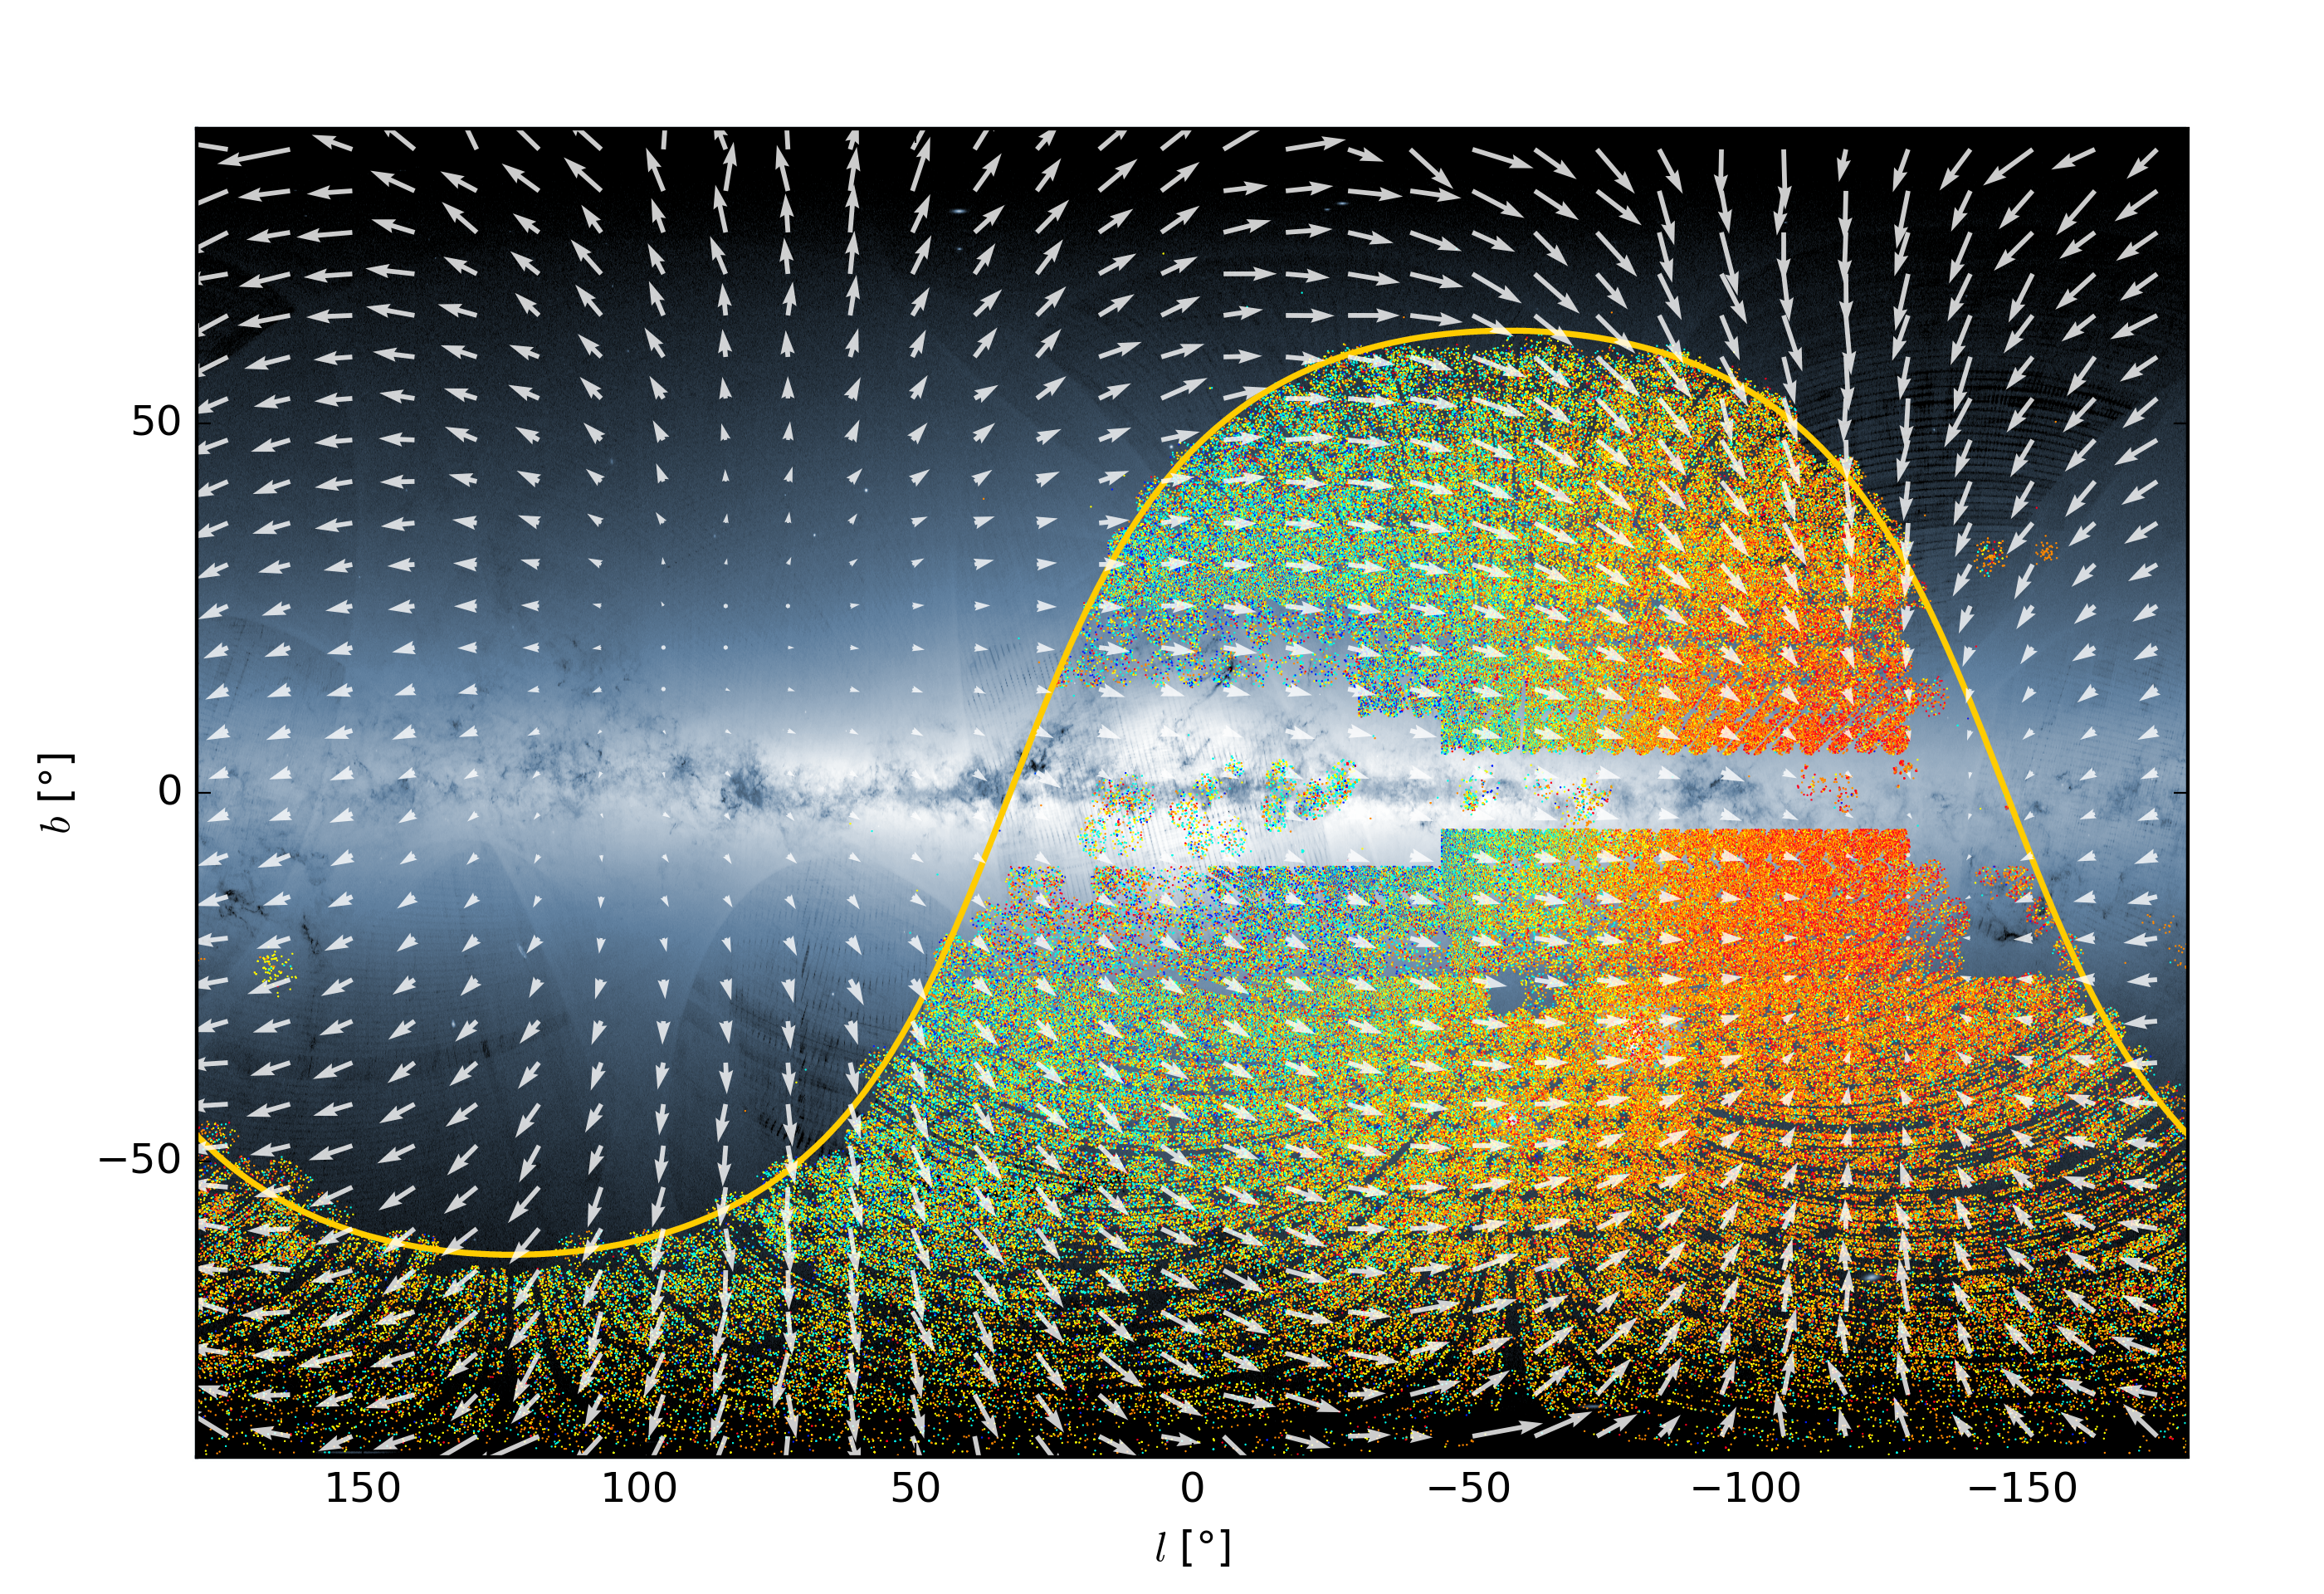
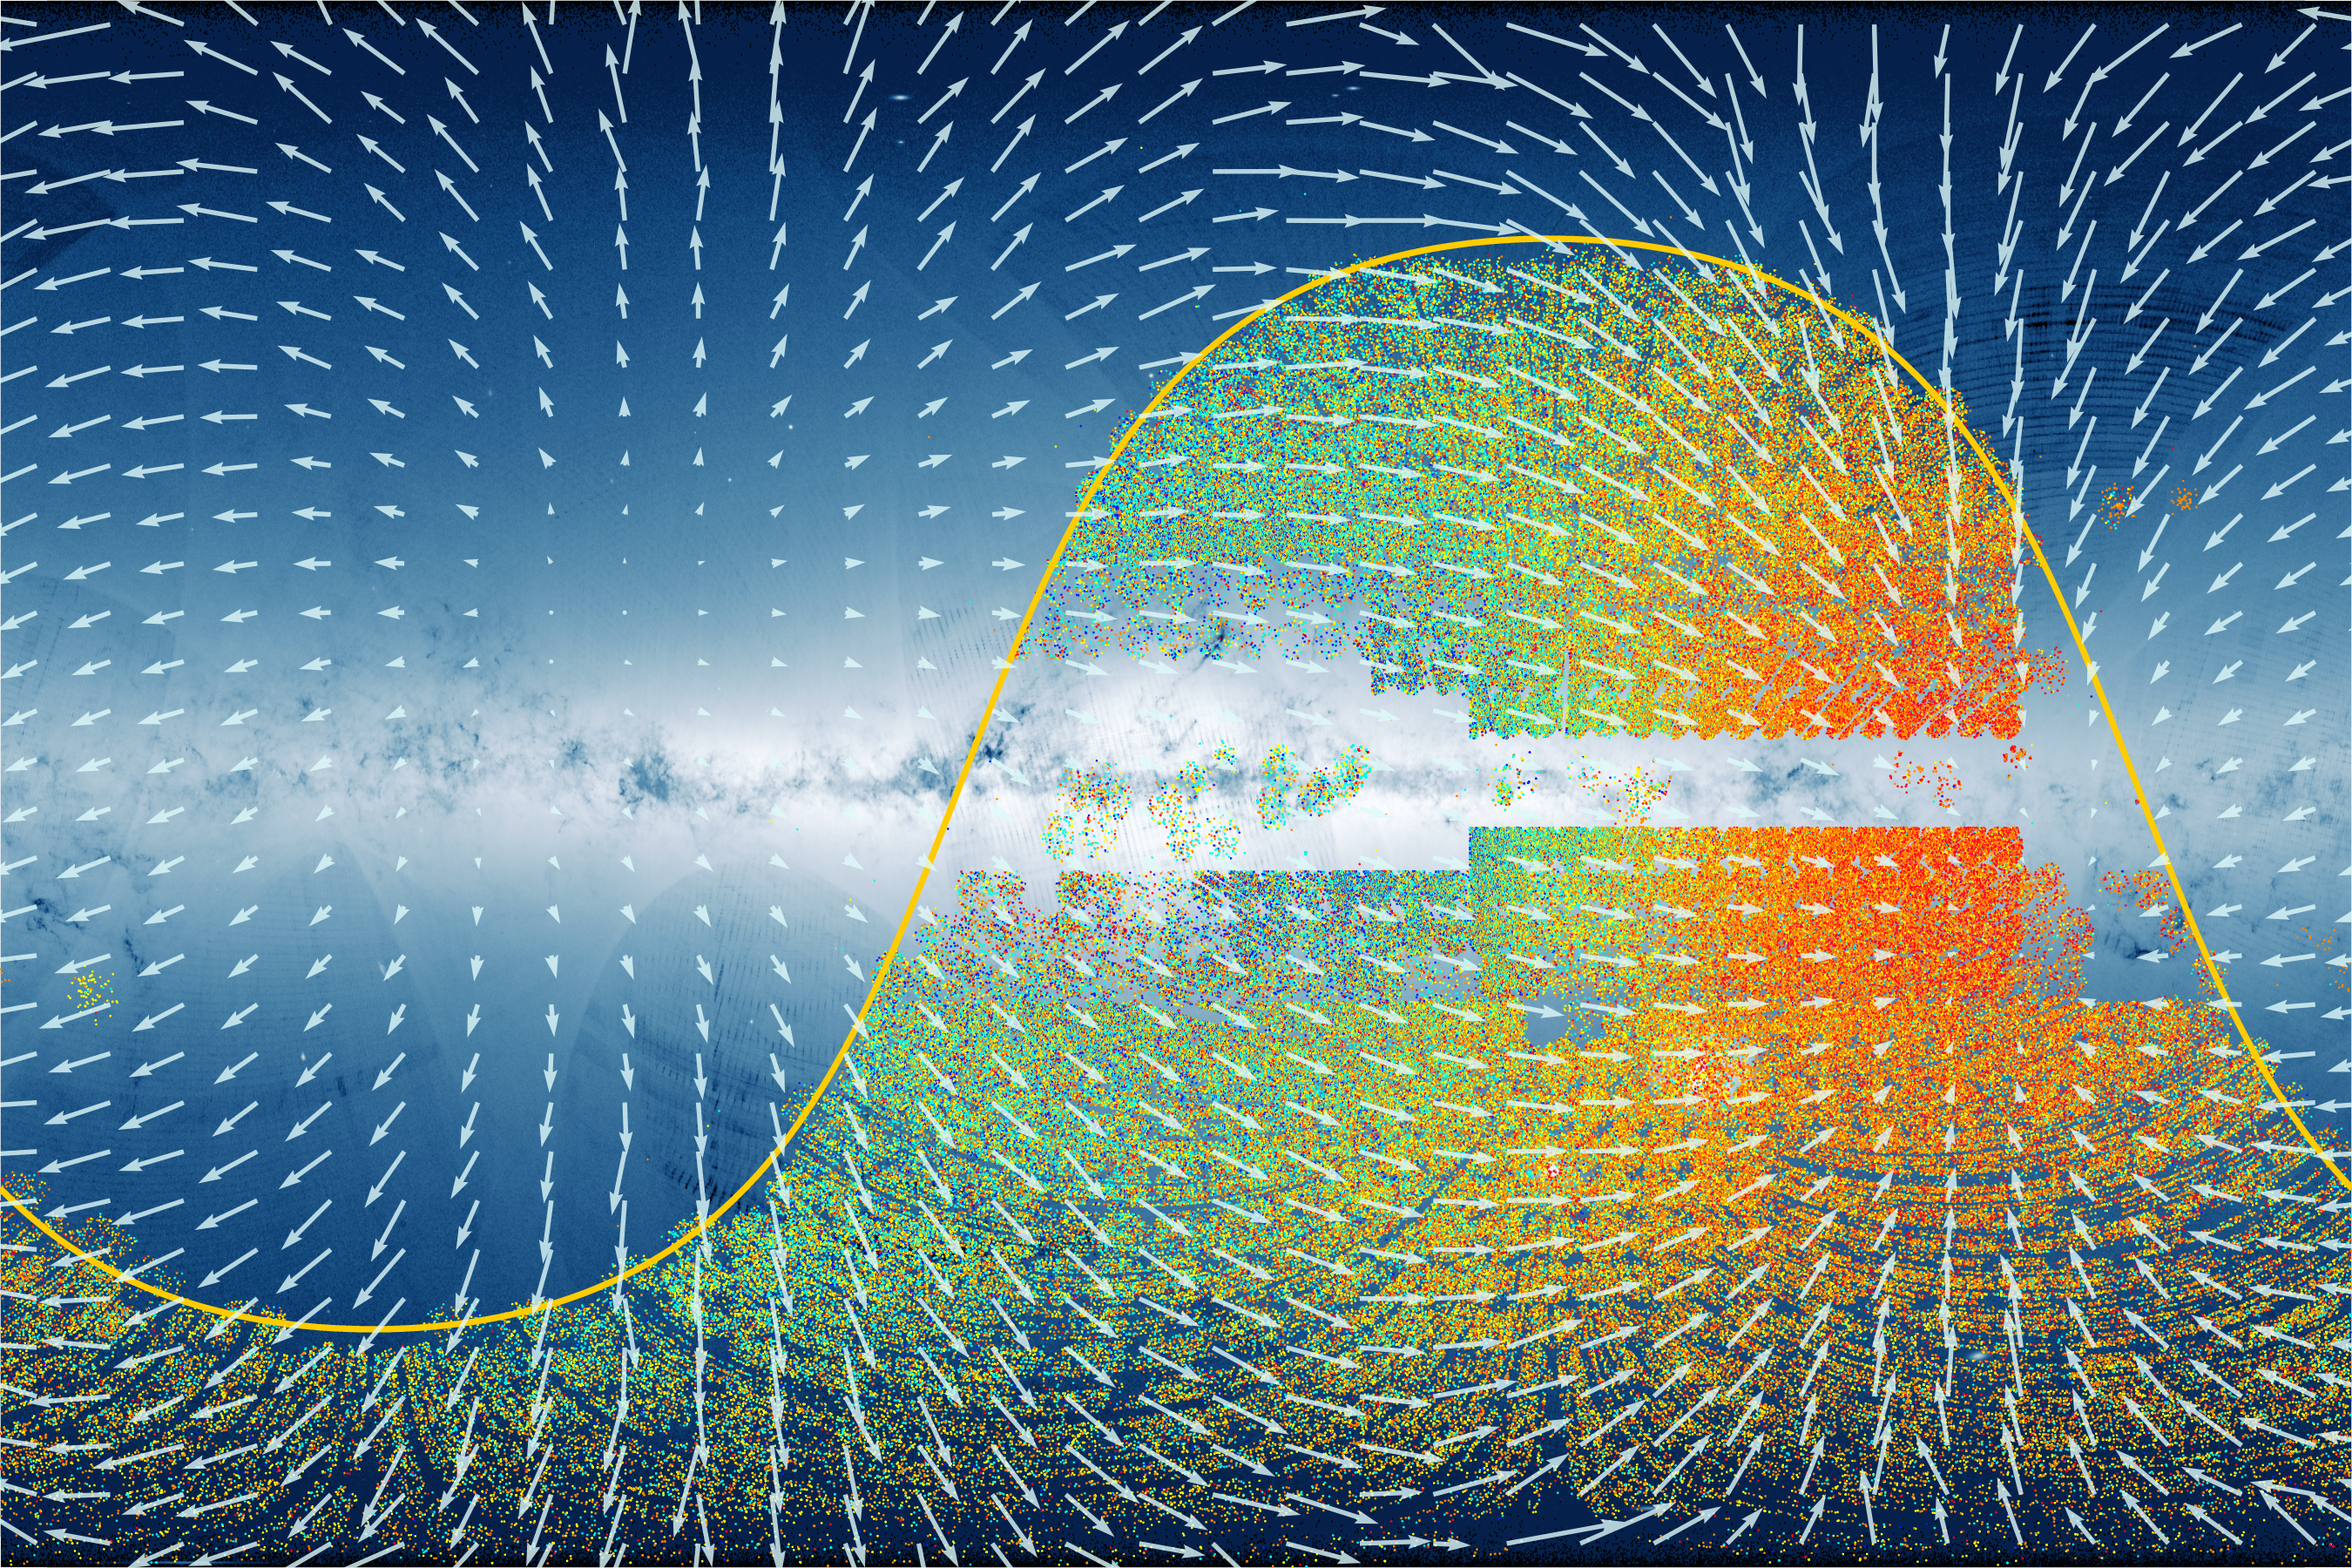
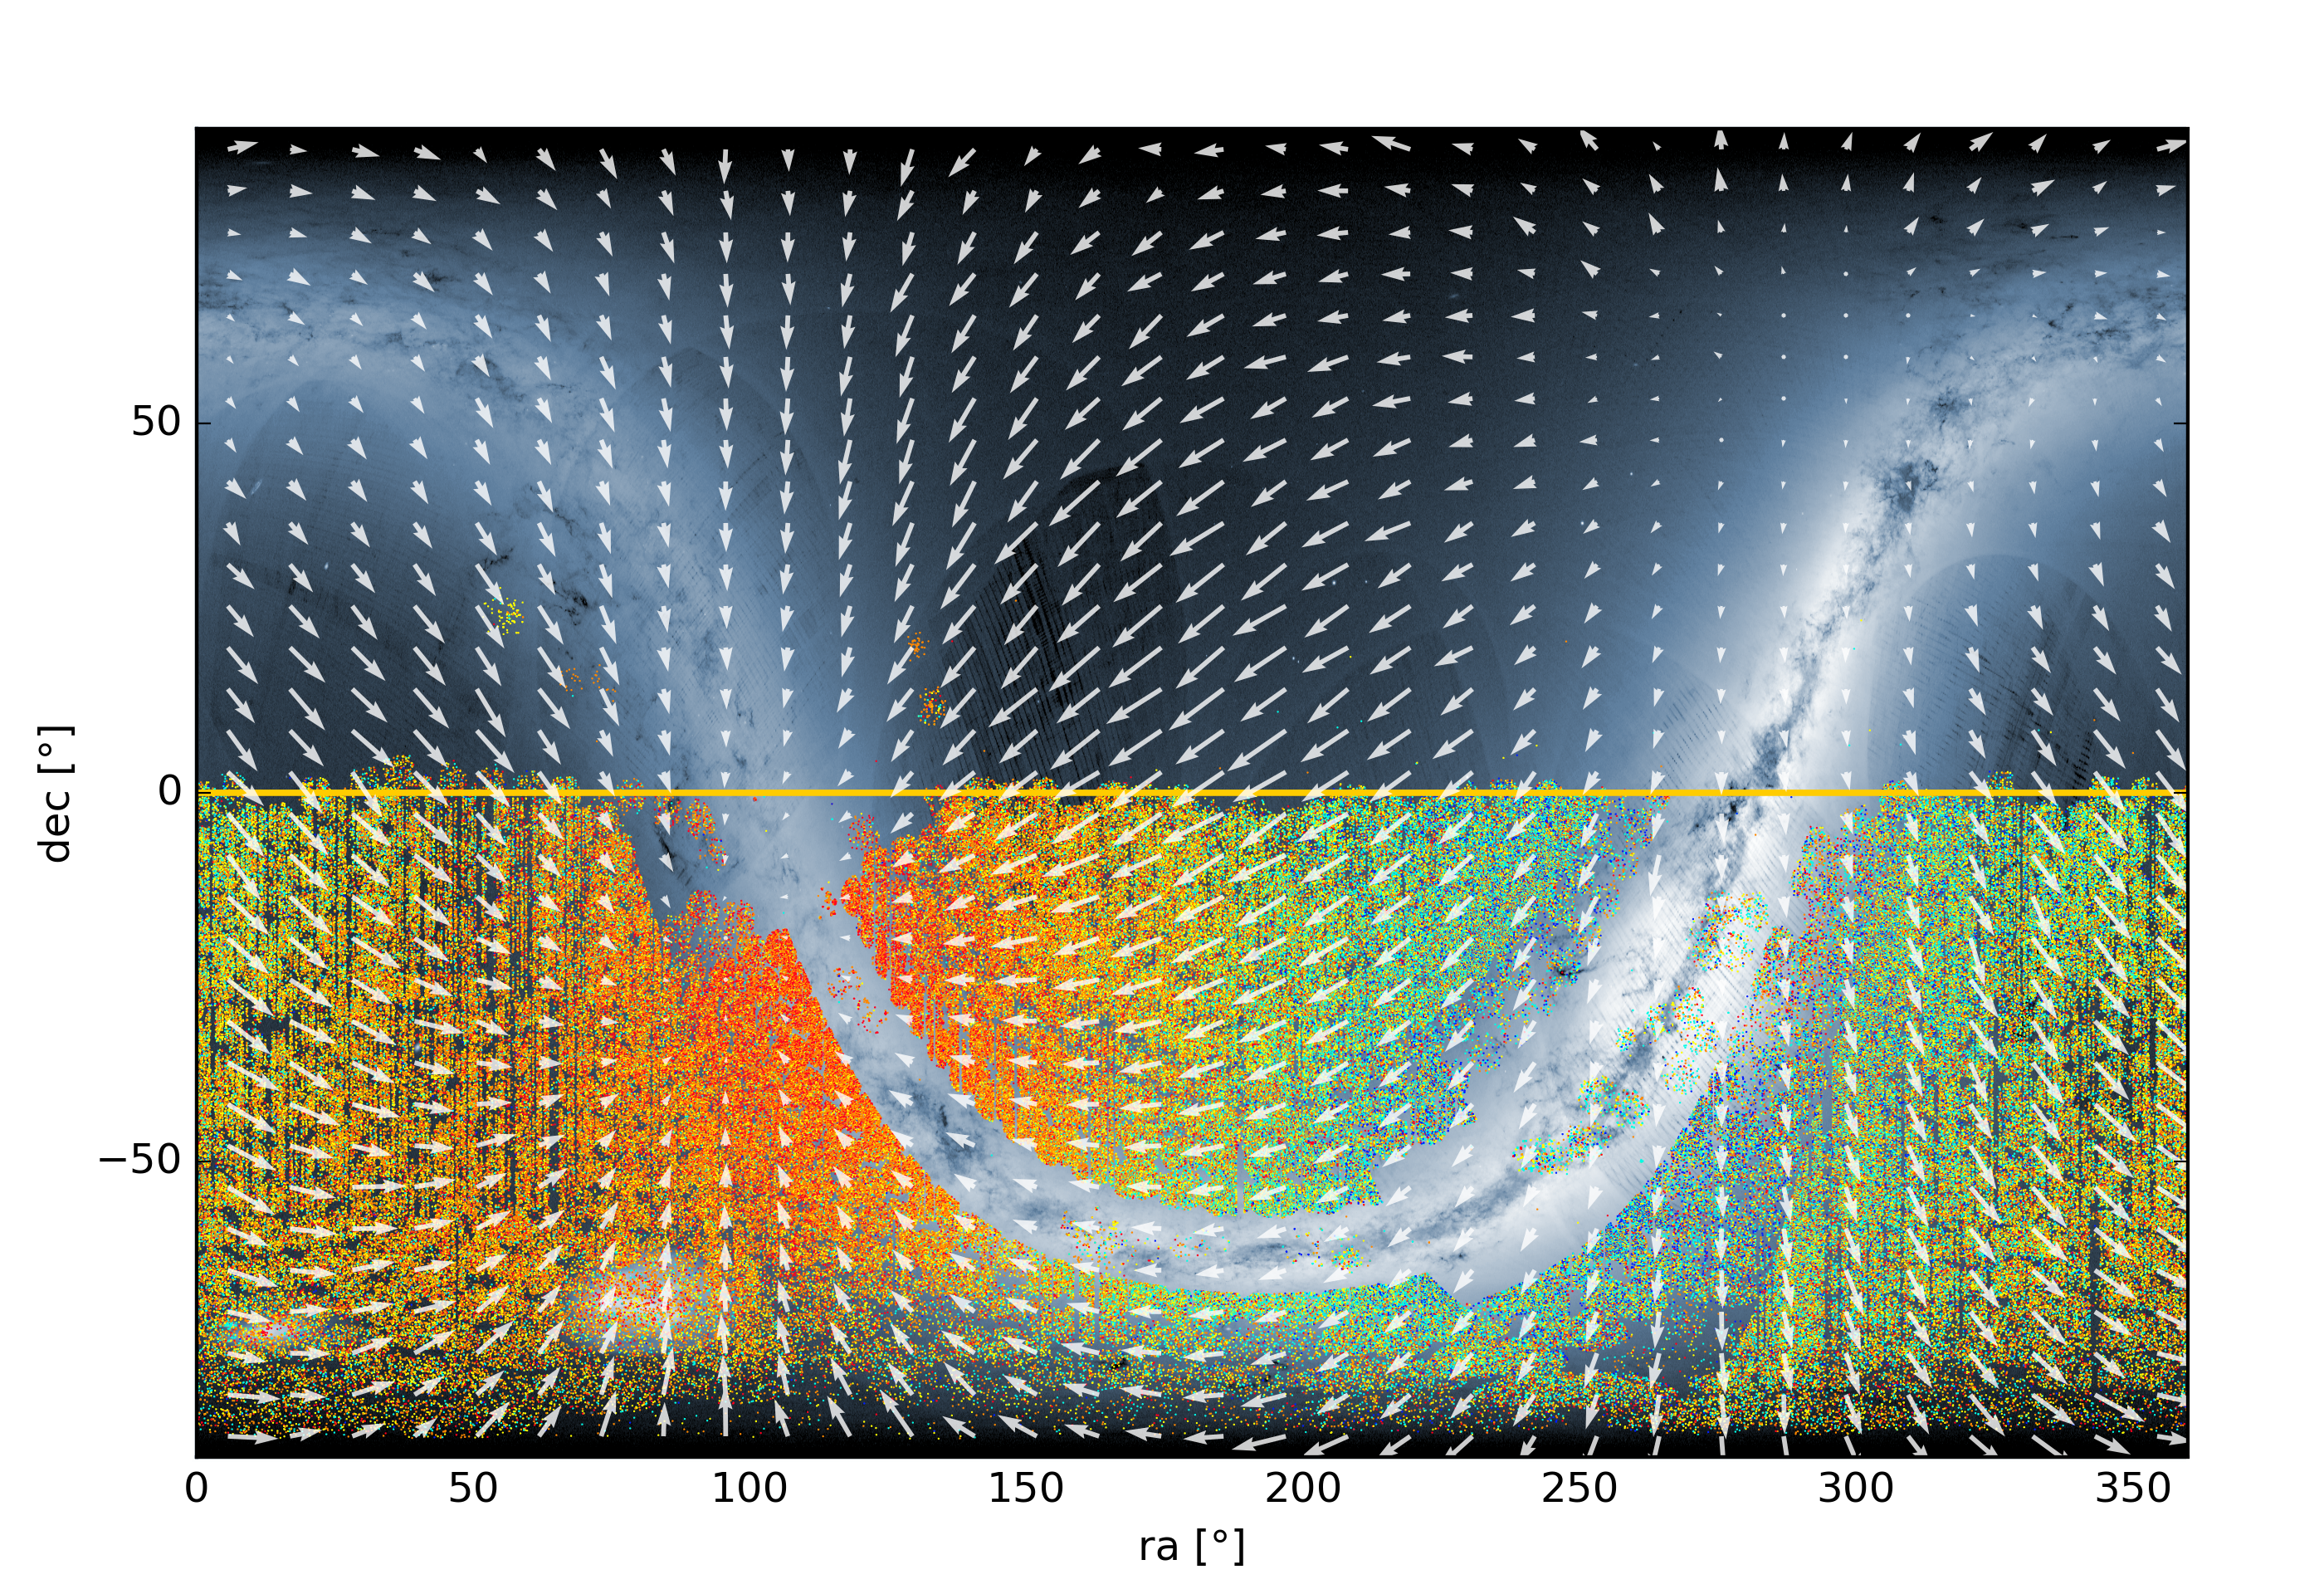
| 3D motion of the Sun with respect to the Milky Way stars as seen by RAVE and TGAS |
| The pictures show the proper motions from Gaia Data Release 1, TGAS-catalogue, as arrows, overplotted with the RAVE stars colored by heliocentric radial velocity. It clearly shows that the sun is moving with respect to the Milky stars.
|
Credit: Maarten Breddels (stellar density and proper motions), Kristin Riebe (RAVE stars); RAVE team
Proper motions and stellar densities were visualised using Maarten Breddels' interactive visualisation tool vaex.
|
galactic coord., high resolution png [28001920, 7.5 MB]
galactic coord.,no axes, png [2400x1600, 7.4 MB]
galactic coord.,no axes, big blue, png [2700x1800, 9.6 MB]
ra/dec, high resolution, png [2800x1920, 7.5 MB]
|
| More versions at E-Science@AIP |
|
  |
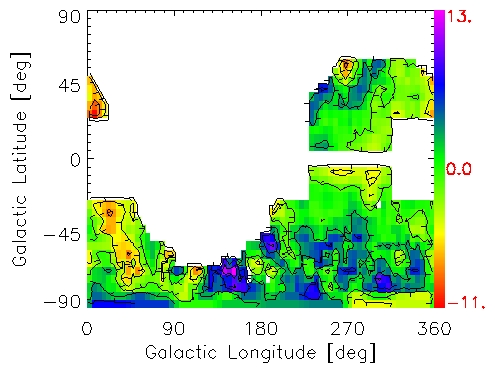
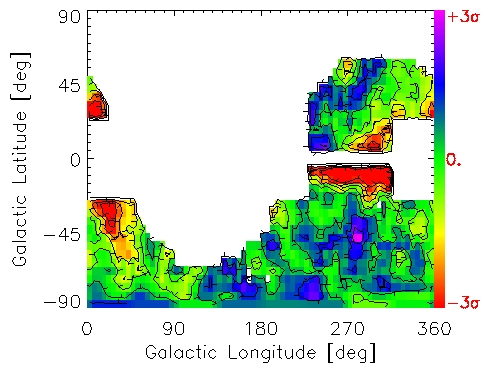
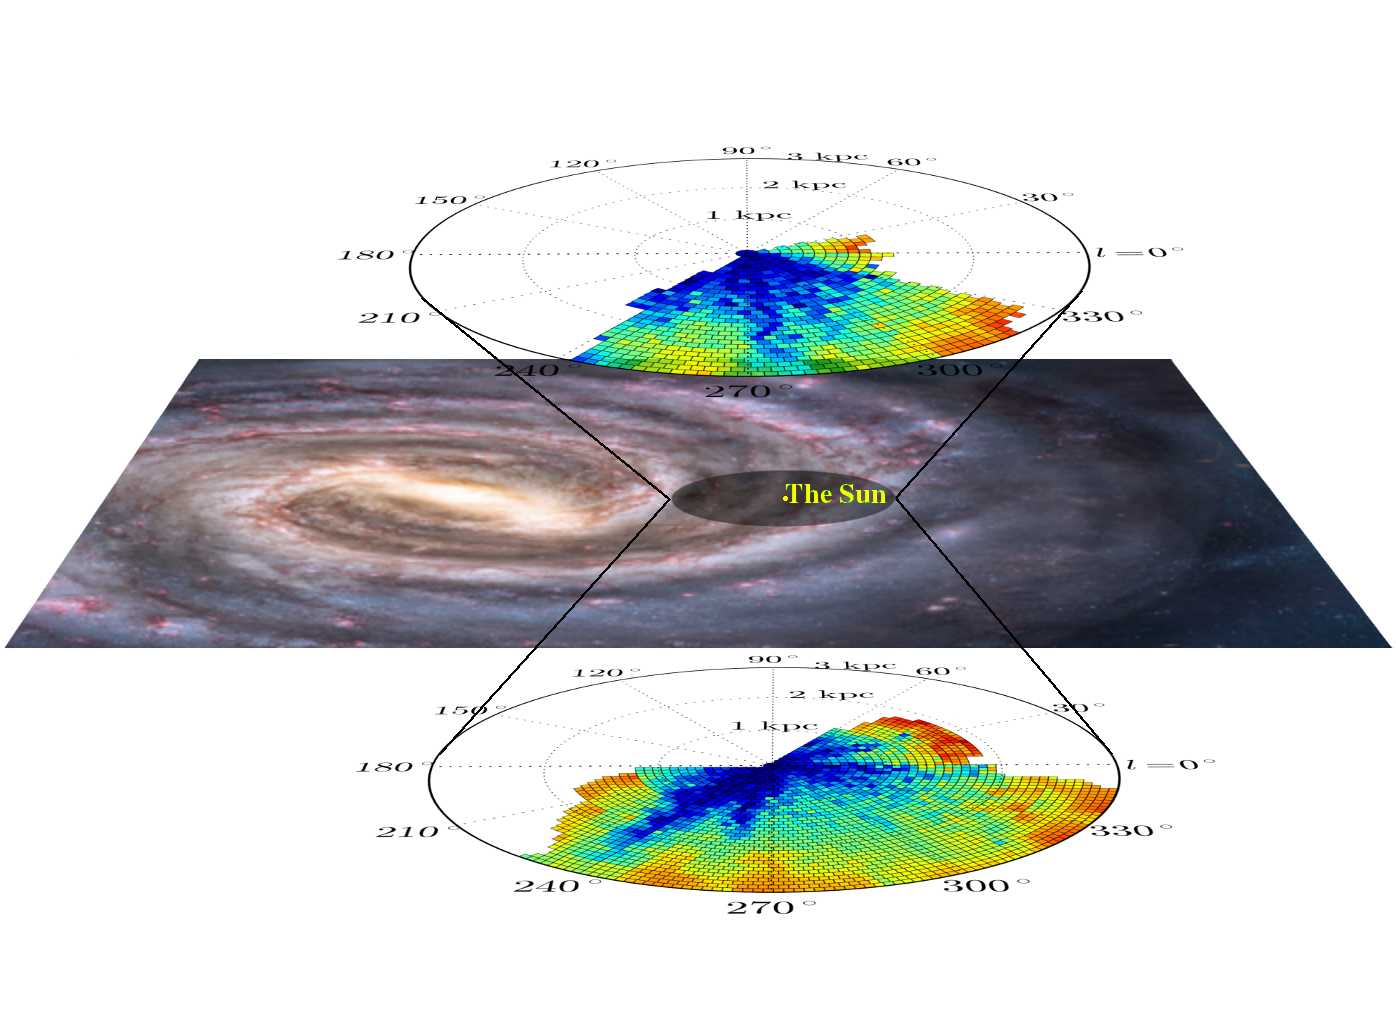
| Maps of absorbed light and dust |
| Maps show the amount of light absorbed by the DIB (left column) and dust (right column). Red color shows more absorbed light than blue color. Top row shows the maps for the northern Galactic hemisphere and bottom row for the southern Galactic hemisphere. These maps show the value an observer in the Galactic plane would measure if he or she observed an object lying in the Galactic plane as well. This is not the case for stars observed with RAVE. They all lie at different distances away from the Galactic plane. To construct the maps, the measured DIB and dust absorption had to be projected into what we would measure if everything was in the Galactic plane. Each bin in the maps represents the measurements at a variety of Galactic latitudes projected into the Galactic plane.
The picture below shows the maps of the measured DIB absorption in respect to the area they cover in our galaxy. |
| Credit: Janez Kos, RAVE team (top) and Janez Kos, RAVE team, Nick Risinger (bottom) |
| png [3025x3005, 2.7 MB] |
| png [1396x1036, 880 KB] |
|
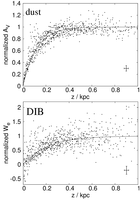 |
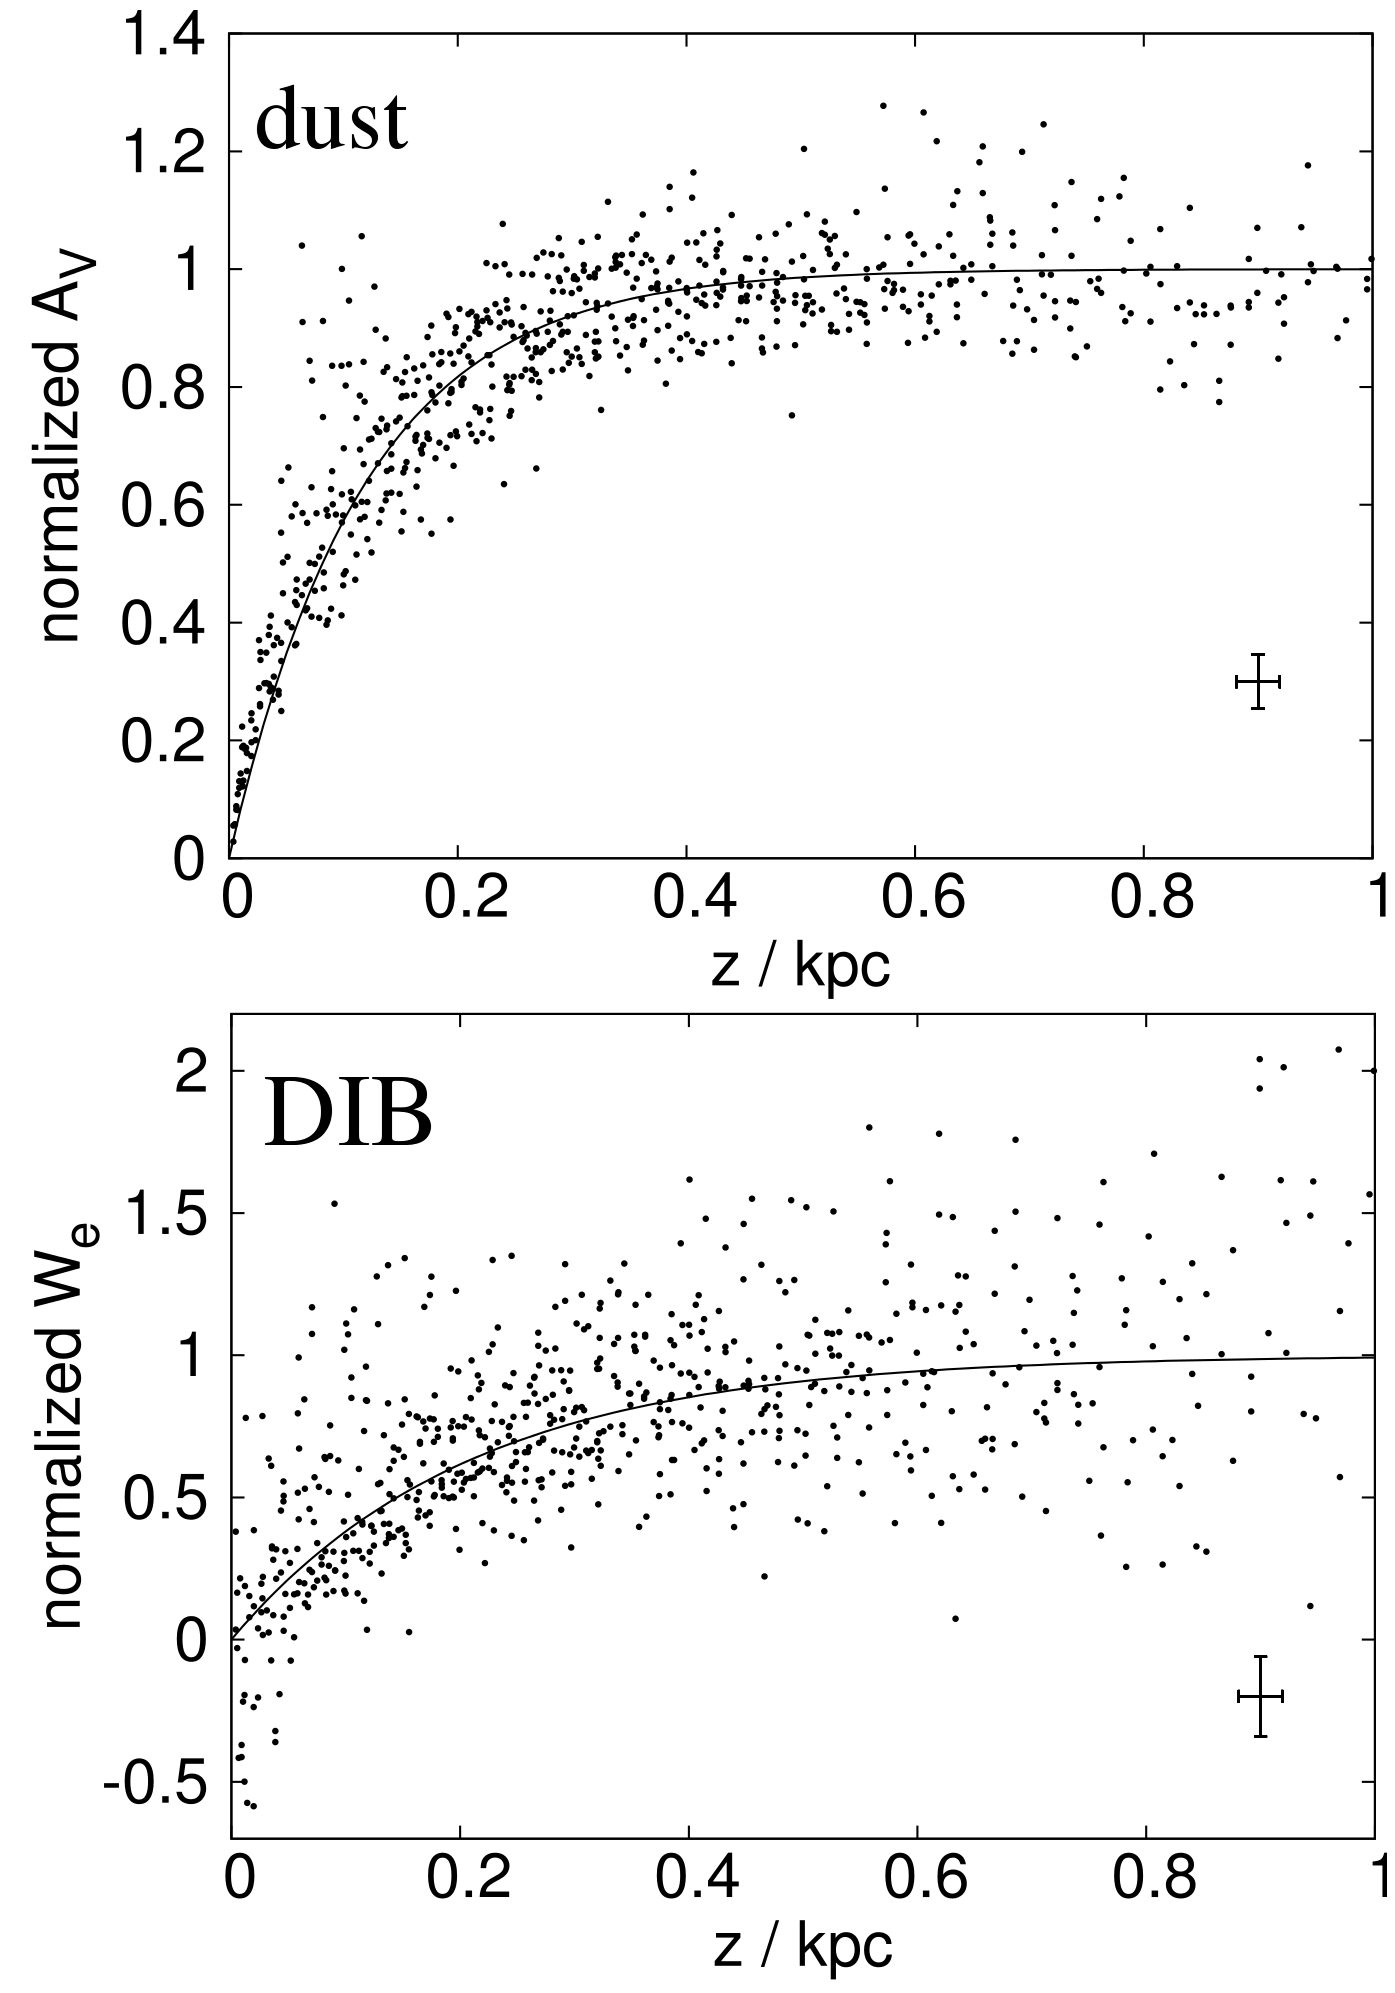
| Scale height |
| In the direction perpendicular to the Galactic plane, the distribution of DIB carriers and dust is described by a simple exponential law, where the density of DIB carriers or dust is given by a density in the Galactic plane (at z=0) and a scale height -- a parameter describing how fast the density drops with distance perpendicular to the Galactic plane. The scale height is measured by comparing the absorbed light in regions at different distances from the Galactic plane (at different z values) independently for the DIB and dust. The measured scale heights are 381±15 light years for the dust and 681±39 light years for the DIB. Such a large difference was not expected, as DIBs and dust generally have a good spatial correlation. |
| Credit: Janez Kos, RAVE team |
| png [1395x1993, 290 KB] |
|
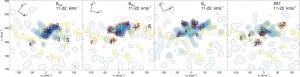 |
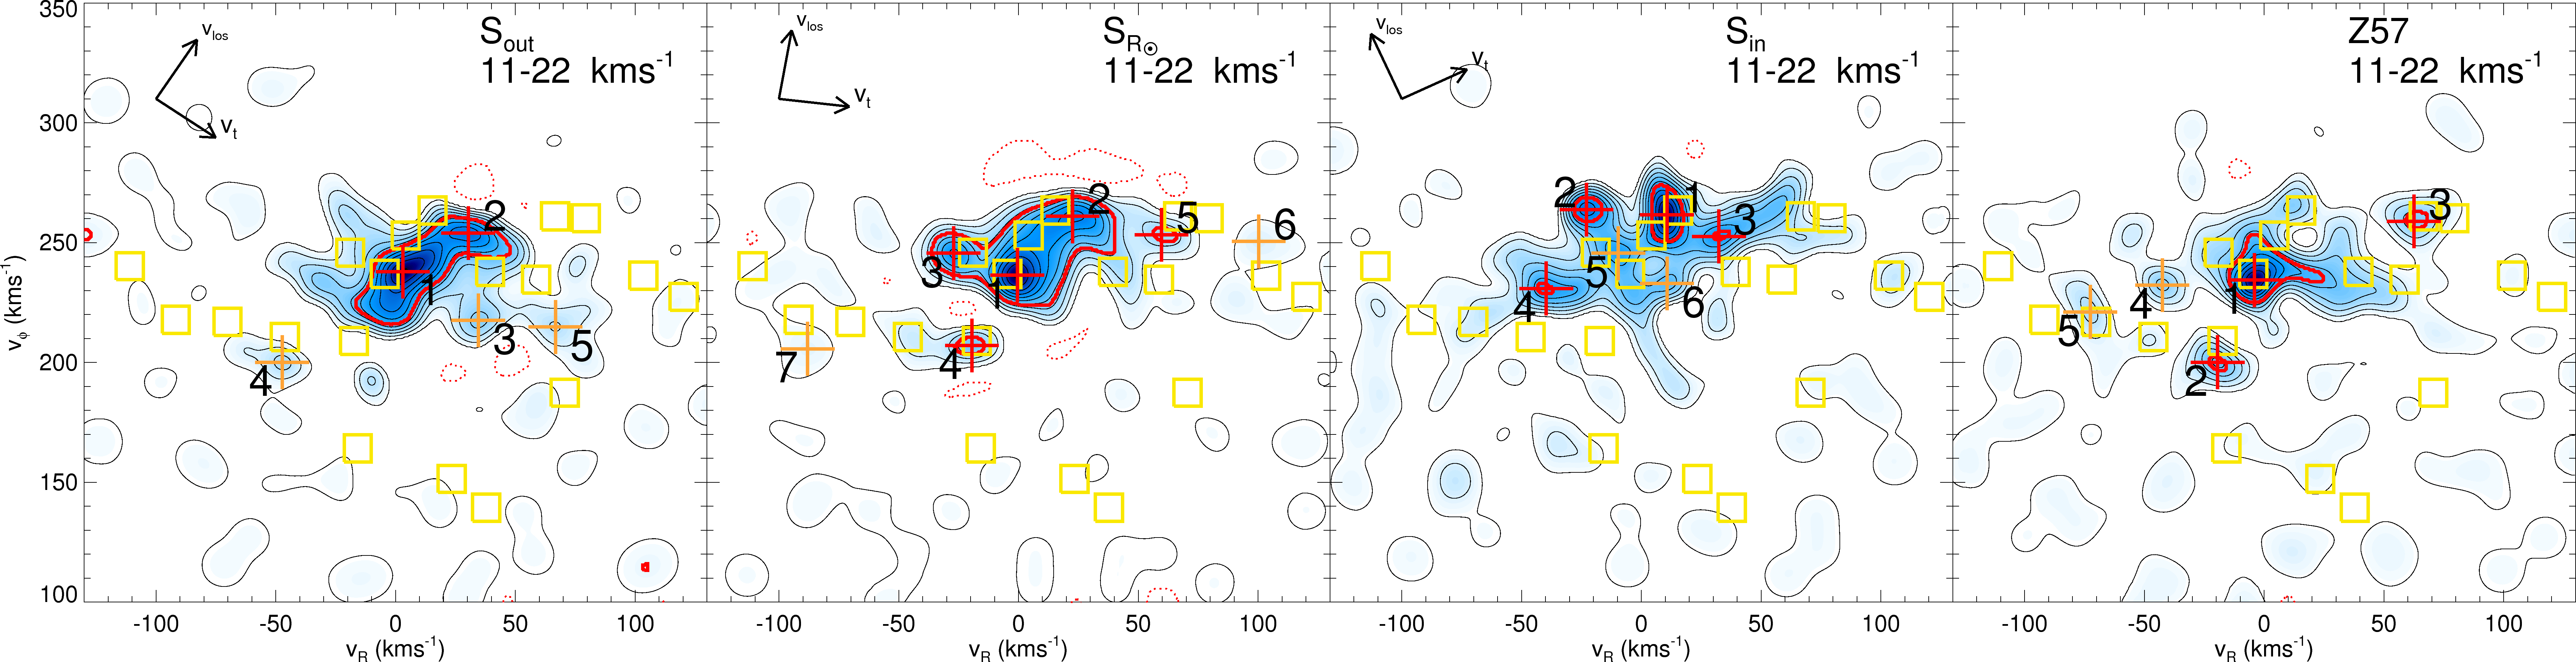
| Kinematic groups beyond the Solar neighbourhood |
| With RAVE we have analysed the kinematic groups beyond the Solar neighbourhood for the first time. We have detected significant overdensities in the velocity distributions using a technique based on the wavelet transform. This plot shows the velocity distributions at different disk locations. The first three panels show the kinematic groups for different Galactocentric radii and the fourth plot corresponds to a region below the Galactic plane. We find that the main local kinematic groups are actually large features, surviving at least up to ˜ 1 kpc from the Sun and also at ˜ 700 pc below the Galactic plane. We also find that for regions located at different radius than the Sun, the known groups change their position on the velocity plane. These trends are consistent with dynamical models of the effects of the bar and the spiral arms. We are currently working on the modelling required to constrain the non-axisymmetric components of our Galaxy using these groups. |
| Credit: T. Antoja, A. Helmi, The RAVE Collaboration, 2012 |
|
 |
| Aquarius Stream |
| Using RAVE data, we measured the radial velocity of 12,000 stars in that region for the first time. In this way we found that 15 stars show a different velocity pattern than the others, moving at relative speeds of up to 720,000 km/h through the rotating disk of the Milky Way. The comparison of the star parameters with simulations showed that those stars form part of a larger stream of stars originating from a smaller neighbouring galaxy which was attracted by the Milky Way. This galaxy finally met the Milky Way and was pulled apart by it about 700 million of years ago, when the stream of stars formed dynamically. This makes the Aquarius stream a special and exceptionally young stream. Other known streams of stars are billions of years old and they are located in the outskirts of our galaxy. |
| Credit: M. Williams, A. Khalatyan (visualisation), The RAVE Collaboration. |
| Article: M. E. K. Williams et al. 2011 ApJ 728 102 |
|
 |
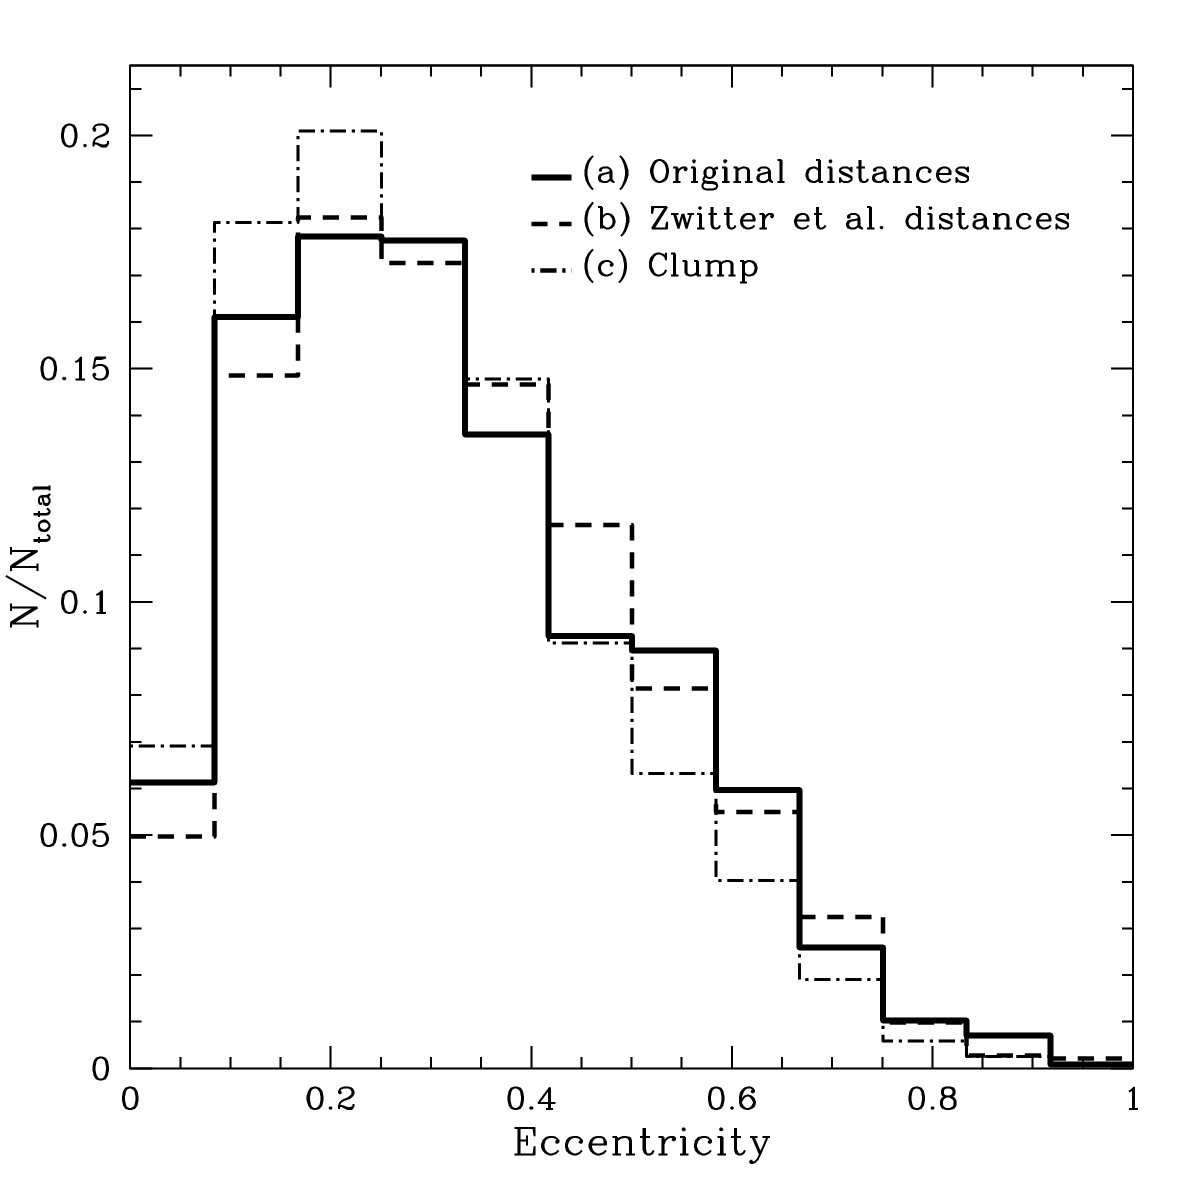
| Eccentricity distribution of thick disc stars |
| The RAVE collaboration has studied the eccentricity distribution of a thick disc sample of stars observed in the Radial Velocity Experiment (RAVE) with the goal of constraining models of thick disc formation. In a paper led by Wilson and Helmi (Groningen) they have reported that the observed distribution peaks at low eccentricities and falls off smoothly and rather steeply to high eccentricities as shown in the Figure. These results favor models where the majority of thick disc stars formed in the Galaxy itself on orbits of modest eccentricity, and disfavor a pure satellite accretion case. A gas-rich merger origin where most of the stars form ``in situ'' appears to be the most consistent with the RAVE data. |
| Credit: A. Helmi, The RAVE Collaboration |
|
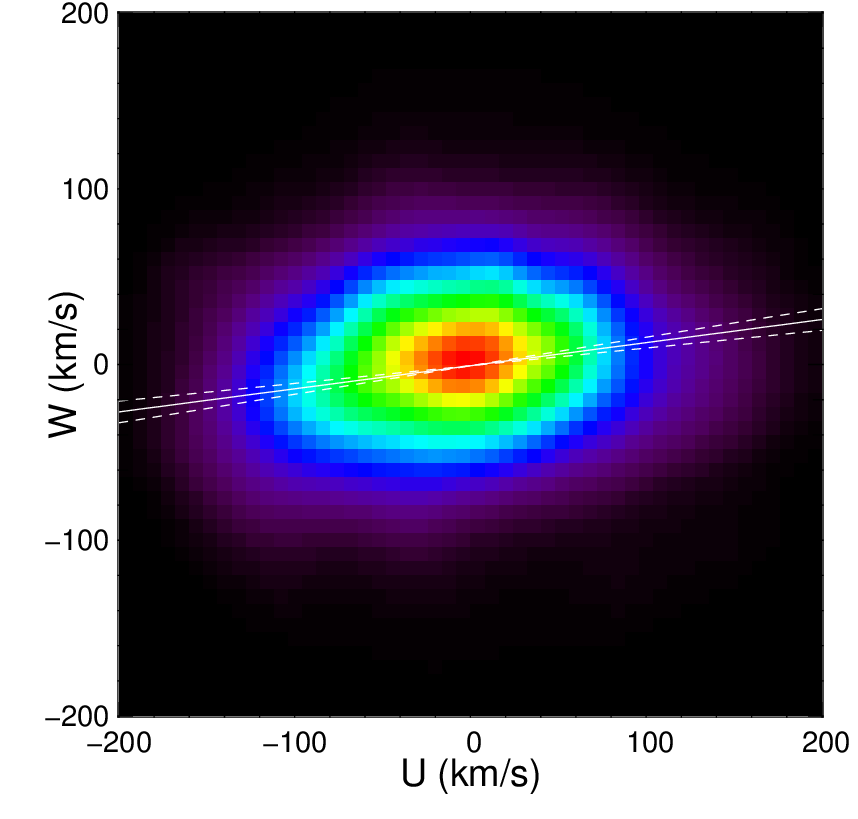 |
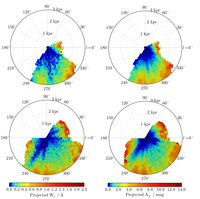
| Inclination of the velocity ellipsoid |
| This is the first measure of the inclination of the velocity ellipsoid outside of the Galactic plane, here at 1kpc below the plane. The plot shows the 2D histogram of the U,W velocities (towards the Galactic centre for U and north Galactic pole for W). |
| Credit: A. Siebert, The RAVE Collaboration |
|
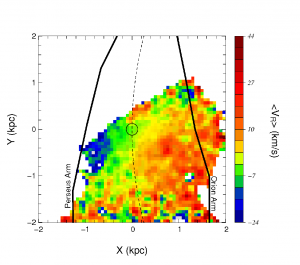 |
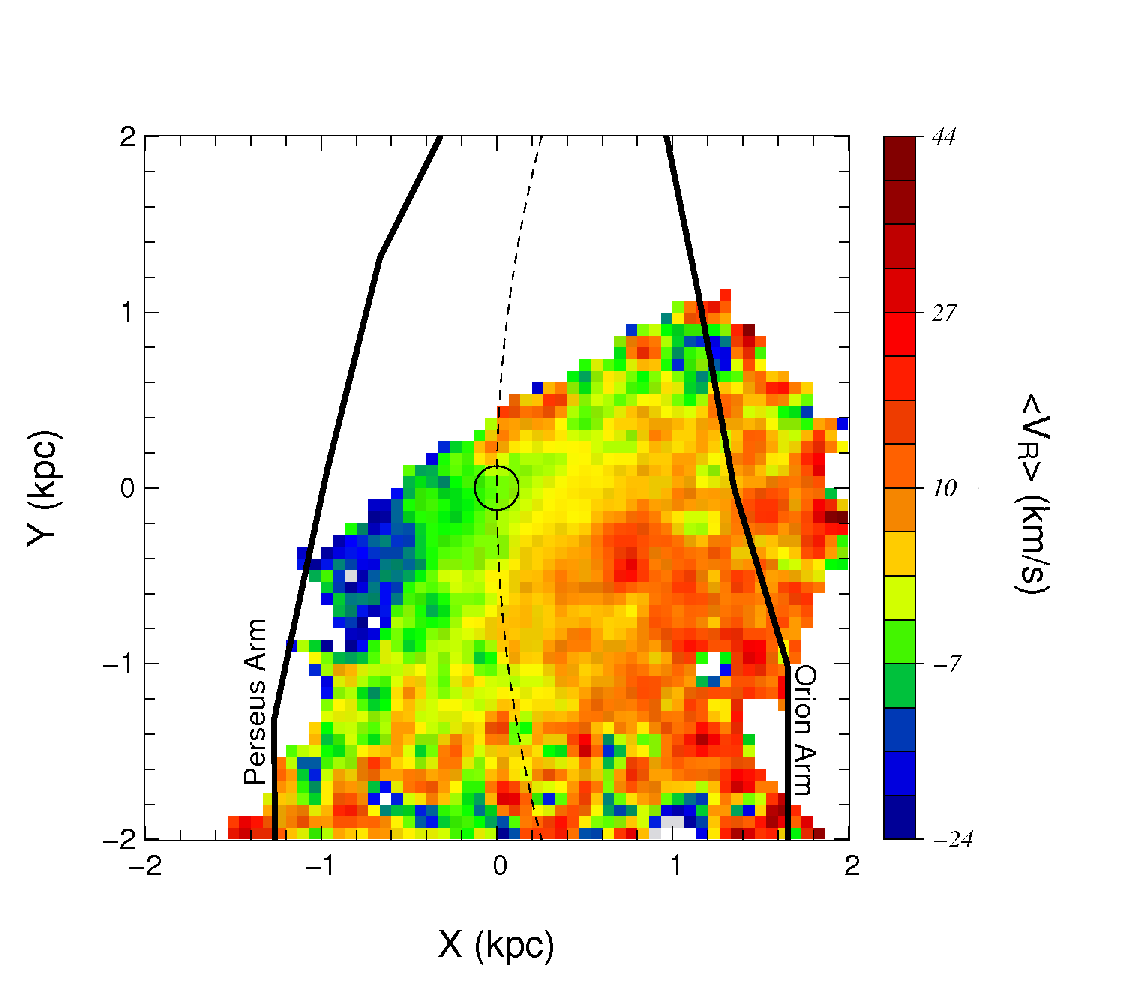
| Detection of a net radial velocity gradient in the Galactic plane |
| The plot shows the median Galactocentric radial velocity in the x,y plane of the disc. X is positive towards the Galactic centre, Y is positive in the direction of Galactic rotation. The black lines are the loctions of the known spiral arms in the gas component, the dashed line is the Sun's Galactocentric radius. Colour code follows the median velocity. |
| Credit: A. Siebert, The RAVE Collaboration |
|
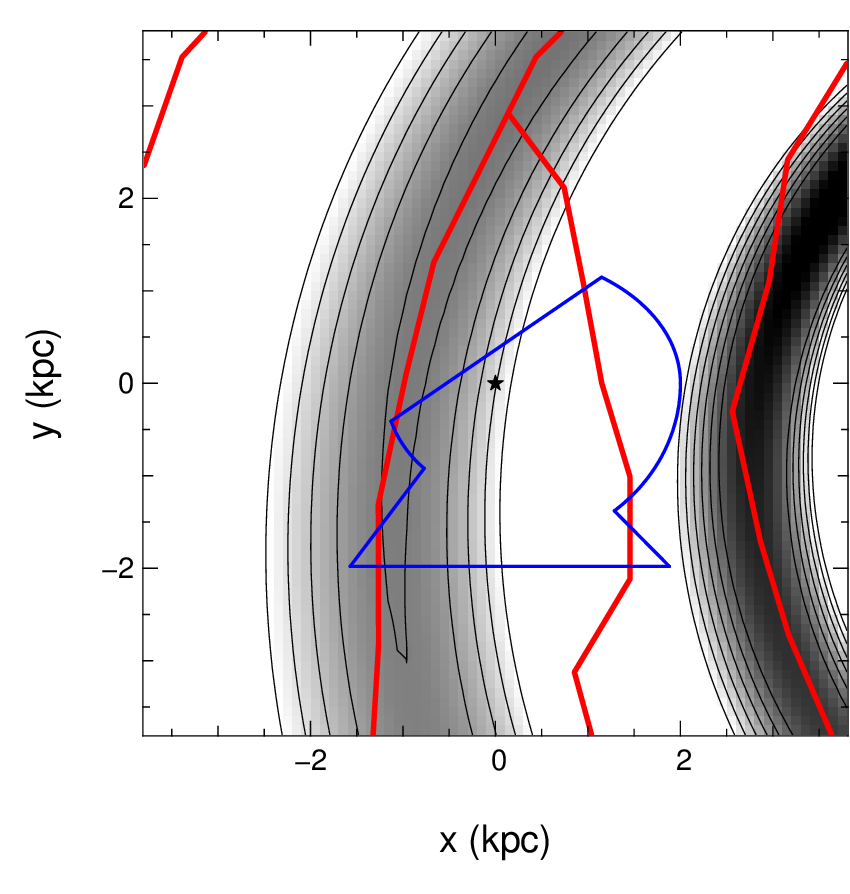 |
| Representation of the spiral arms |
| This plot is a representation of the spiral arms if one assumes that the previous plot (radial velocity gradient) is due to perturbations by a spiral pattern. It compares the location of the arms in the gas (thick red lines) to the density distribution of the perturbation for the best fit model of the previous velocity field (gray colour). The blue line is the limit of the RAVE data in the X,Y plane (same definition as for the previous plot). |
| Credit: A. Siebert, The RAVE Collaboration |
|
 |
| RAVE radial velocities compared with Besancon Model |
| The pictures show the comparison of the radial velocities observed by the RAVE survey to the predictions by the Besancon Model of the Galaxy for giant stars, smoothed once using a standard box-car smoothing algorithm. The first picture shows the difference in the mean radial velocities per pixel (RAVE - Besancon). The second picture shows how the RAVE values compare to 30 random samples drawn from the Besancon data. The random samples reproduce the I-magnitures of the stars observed by RAVE in each pixel. The difference shown in the second image is the difference in terms of standard deviations of the 30 (mean) radial velocities of the random samples from the Besancon Model. The orange/red structure in the lower left corner is the recently in the RAVE data discovered Stream of Aquarius (Williams et al. 2010). |
| Credit: A. Ritter, The RAVE Collaboration, 2012 |
|
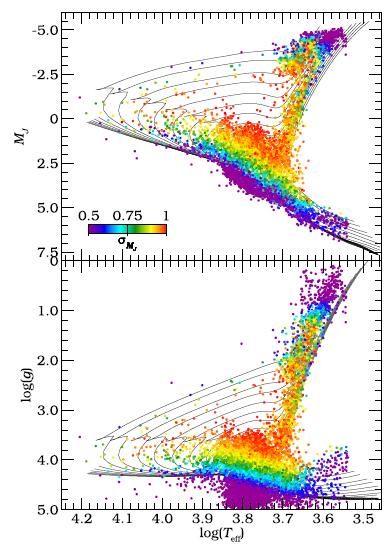 |
| RAVE Isochrones |
| Credit: M. Breddels 2009, The RAVE Collaboration |
|
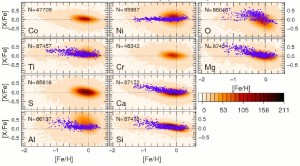 |
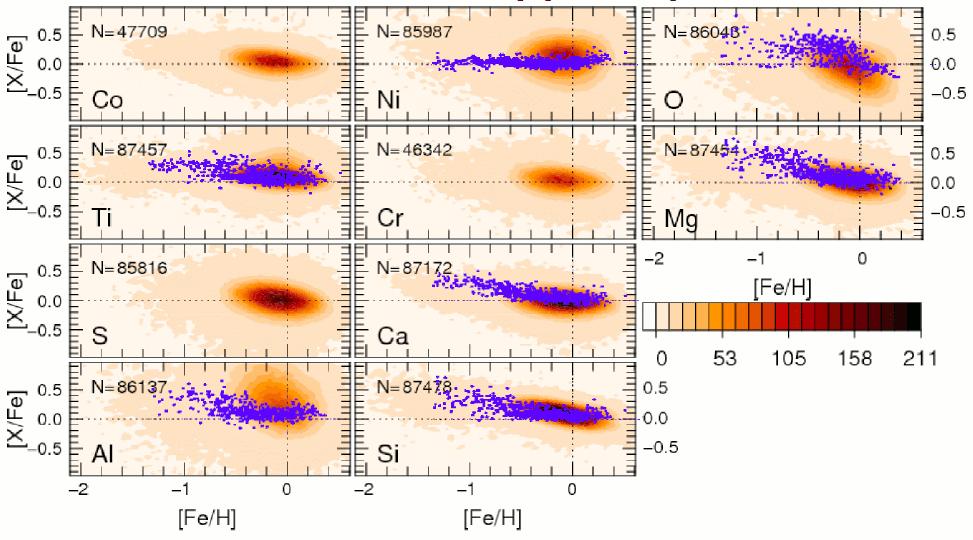
| Chemical Abundances |
| Credit: C. Boeche, The RAVE Collaboration |
|
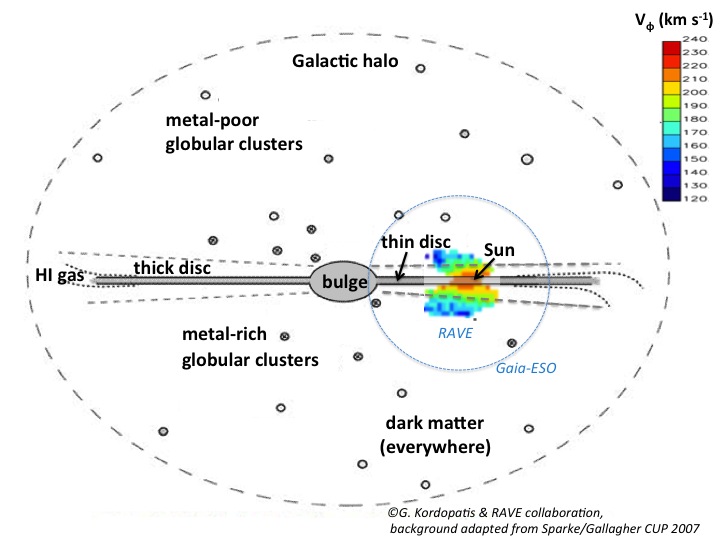 |
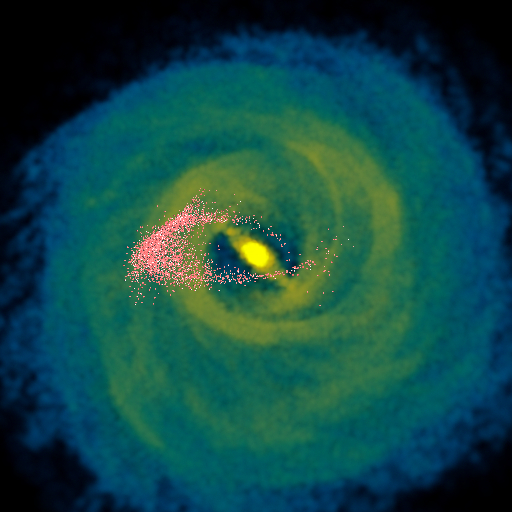
| RAVE targets cartoon |
| Cartoon edge-on view of our Galaxy and volume probed by RAVE, colour-coded by the azimuthal velocity map of the RAVE targets (Kordopatis et al., 2013 MNRAS). The maximum distances probed by the Gaia-ESO survey are also indicated, for comparison purposes. |
|

![galactic coord.,no axes, png [2400x1600, 7.4 MB]](../img/gaia_tgas_ravedr5_noaxes.png)